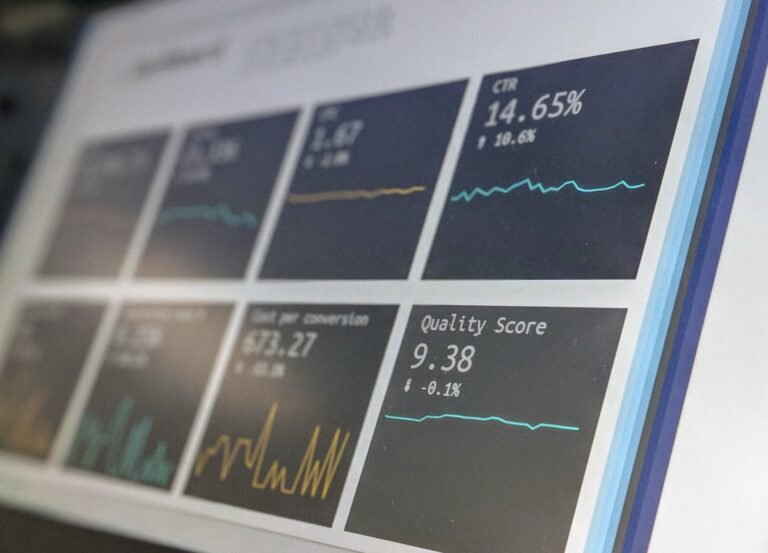

What Is a Good AI Visibility Score? Benchmarks and How to Read Yours
You ran a visibility check and got a number. Perhaps it was 34, perhaps a letter grade, perhaps a percentage. The obvious next question — is that good? — is harder to answer than tools implying precision would suggest.
There’s no industry-standard AI visibility score. Every tool computes its own, from its own prompts, across its own engines. Understanding what your score is made of is more useful than comparing it to anyone else’s.
What does an AI visibility score actually measure?
Nearly every score in this market is a weighted composite of a few underlying rates, sampled over a prompt set the tool selected.
- Citation rate — the share of answers that link your domain.
- Mention rate — the share that name your brand without a link.
- Position or prominence — whether you appear early in the answer or in a trailing list.
- Share of voice — your appearances relative to the competitor set the tool chose.
- Sentiment — sometimes folded in, usually crudely.
Three of those inputs are decisions the vendor made on your behalf: which prompts, which engines, which competitors. Change any one and your score moves substantially without anything about your website changing at all. That’s the single most important thing to understand about these numbers.
So what is a good score?
The honest answer is that a good score is defined relative to your own category and your own baseline, not to a published benchmark. Some general reasoning still holds across sectors.
Expect low absolute numbers on unbranded questions
An answer engine typically draws on a small handful of sources per response. If your category has dozens of credible players, plus aggregators, review sites and trade publications competing for those slots, appearing in a meaningful minority of answers is a strong result. Anyone promising near-total presence on generic category questions is either testing narrow prompts or selling something.
Expect high numbers on brand questions
Questions containing your company name should return you almost every time. If they do not, you’ve a retrieval or accuracy problem serious enough to fix before anything else.
Judge comparison questions separately
“Best X for Y” and “alternatives to Z” are where purchase decisions form. Presence there is worth several times presence on definitional questions, and most scoring tools weight them identically. Always disaggregate.
How to read your own score properly
Four questions turn a vanity number into something you can manage against.
- What prompts produced it? If you cannot see the prompt list, you cannot interpret the score. A set weighted toward your brand name inflates it; a set of broad generic questions deflates it.
- Which engines, and how weighted? Some engines cite far more freely than others. A score dominated by generous-citing engines will flatter you relative to where your buyers actually are.
- How many runs per prompt? Variability is large. A score built on one run per prompt has an error bar wide enough to swallow a quarter’s progress.
- Who is in the competitor set? Share-of-voice metrics are entirely determined by the comparison group. Include a category giant and everyone looks small; include only direct peers and the picture is fairer and more actionable.
The numbers worth watching instead
Composite scores are useful for tracking direction over time. They’re poor at telling you what to do next. These four diagnostics are better.
- Coverage. Of the questions your buyers actually ask, how many produce any presence from you at all? Zeros are the cheapest wins in the discipline — they usually indicate content that simply does not exist yet.
- Accuracy. When engines describe you, how often are they right? Weight this heavily. A confident, wrong description costs more than an absence.
- Citation-to-mention ratio. Many mentions and few citations points at retrieval or structural problems, not awareness problems.
- Competitive displacement. On your priority questions, who is consistently occupying the slots, and what is structurally different about the pages being cited?
A practical way to set your own benchmark
Because there’s no external standard, build an internal one. It takes an afternoon and it survives tool changes.
- Define forty to sixty questions grouped into brand, category, comparison and problem tiers.
- Pick three engines and hold them constant.
- Run each prompt at least three times, recording citation, mention and accuracy per run.
- Compute a rate per tier, not one blended number.
- Record the same rates for three named competitors, giving you a relative floor and ceiling that reflect your actual category.
- Re-run monthly. The competitor rates tell you whether a change is yours or the market’s.
Our free ARIA Citation Tracker does this against your own prompt set rather than a vendor-chosen one, which is the difference between a benchmark you can act on and a number you can only quote. For individual pages, the AI Citability Scorer assesses structural citability before publication, so you aren’t waiting a month to learn that a page was unquotable.
What a rising score does and does not prove
A rising score is encouraging, but confirm it’s real before reporting it upward. Scores rise for at least four reasons unrelated to your work: an engine changed its retrieval behaviour, the vendor changed its prompt set or weighting, a competitor’s content was deprioritized, or normal run-to-run variance broke your way.
Two controls separate signal from noise. Track competitor rates on the same prompts, so a market-wide shift is visible as a market-wide shift. And keep a small holdout group of pages you deliberately do not optimize; if their citation rate rises identically to your optimized pages, the movement was not yours.
Frequently asked questions
Is there an industry benchmark for AI visibility scores?
No credible universal one exists, and you should be sceptical of any figure presented as though it does. Scores are vendor-specific composites built from vendor-chosen prompts and engines, so cross-tool comparison is not meaningful.
Benchmark against your own trend and against named competitors measured on the identical prompt set.
My score is low. Is that a content problem or a technical problem?
Check technical first, because it is faster to rule out. If AI crawlers are blocked, your pages render only via client-side JavaScript, or key content sits behind interstitials, no amount of writing will help.
Once retrieval is confirmed, low scores are usually structural: long preambles, vague headings and passages that don’t stand alone.
How quickly should a score improve after we fix things?
Expect movement over weeks to months rather than days, and expect it to be uneven across engines. Engines that browse live can pick up new material quickly; those relying on periodic indexes or model updates lag considerably. Judge on quarterly trend.
Should we report this score to leadership?
Report the trend and the tier breakdown, not the headline number alone. “We now appear in four of twelve comparison answers, up from one, and our description is accurate in all of them” is a defensible statement, whereas a bare score invites a question about what it means that no one can answer. If you want this built into a reporting framework that holds up, that is part of our AI visibility work.
Get the next one in your inbox.
Practical insights — no fluff, straight to your inbox.
Or follow us on LinkedIn:
Follow StrategyPeeps